
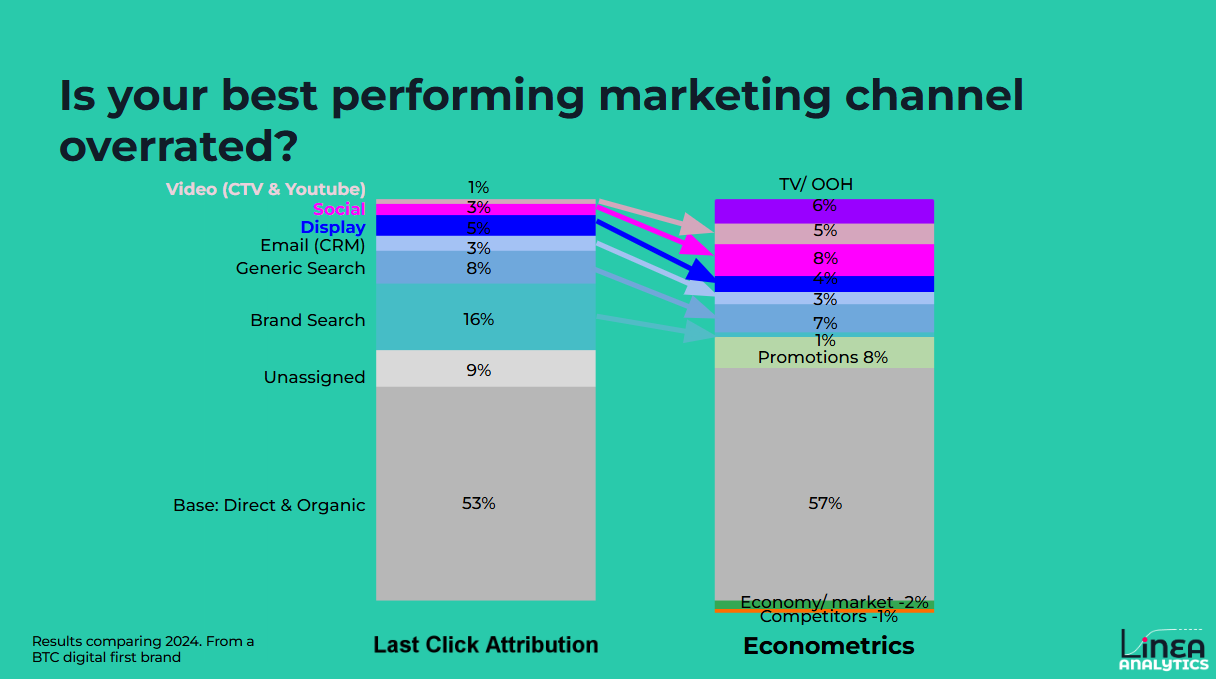
Comparing the difference between last-click attribution and Econometrics
Your 'Best Performing' Media Channel Might Be Overrated.
Your Adobe Analytics or GA dashboards are in the green ✅
But you know deep down: those numbers show what you can track. Not necessarily what’s driving growth in new customers.
So, how do you uncover the real drivers?
That’s where we use techniques like Econometrics [also known as Marketing Mix Modelling (MMM)]. Like in the example with data from 2024 of a Tech Company we worked with at Linea.
Rather than just assigning credit to the last click, MMM measures incrementality. Capturing how all factors (media, promotions, economic conditions, market trends) work together to generate sales.
Let's look at the results. Because it's often surprising:
❌ Brand & non-brand search: Overvalued in your last click
❌ CRM/email: overvalued
❌ Display (especially retargeting-heavy): overvalued
✅ Social: undervalued
✅ Video (CTV, YouTube): undervalued
✅ TV & OOH: usually not even measured in last-click setups
Why do we see a difference in results?
Channels closer to the point of conversion get more credit in last-click attribution. This often overvalues media channels like Search. Taking the example of brands search. Whilst last click attribution may show that it drove a customer. The reality is that this may have been driven by other activity such as a TV or YouTube advert driving customers to search for a brand.
In many cases last-click attribution undervalues the upper funnel, where we see demand is actually created. That's why we use more incremental focused measurement approaches to better measure all channels in an equal way.
This doesn’t mean you stop spending on overvalued channels. We can compare the newly generated ROI to understand if those overvalued channels are actually driving payback.
What it does mean is you now have a clear, fair view of what’s working. At Linea we can use our future facing tools, such as for scenario planning, to make smarter decisions.
📊 Can we scale high-performing, undervalued channels?
🔁 How should we reallocate H2 budgets?
💡 Are we spending enough overall to hit our growth targets?